Many performance tools give you performance data in the form of a single performance rating, or maybe that plus a 9-box (a where managers make a judgement of an individuals "potential). We don't believe this is an objective-enough tool to actually understand how folks are performing and drill into the leverage that can really improve performance outcomes.
Check out these 6 ways to better understand employee performance—so you can make better decisions on pay, promotions, growth opportunities and have a much better sense of where you should invest your resources to enable employees to have a bigger impact.
What it is: A distribution of employees by their growth progress through their level as demonstrated by the % of competency attainment (live progression status).
Why it matters: You see both seniority and progress. That lets you spot your true top performers—the people who are highly skilled and far through their current level—so you can target stretch work, mentorship, or promotion panels. This gives you an idea of who will be ready to level up in the coming months.
What you do with it:

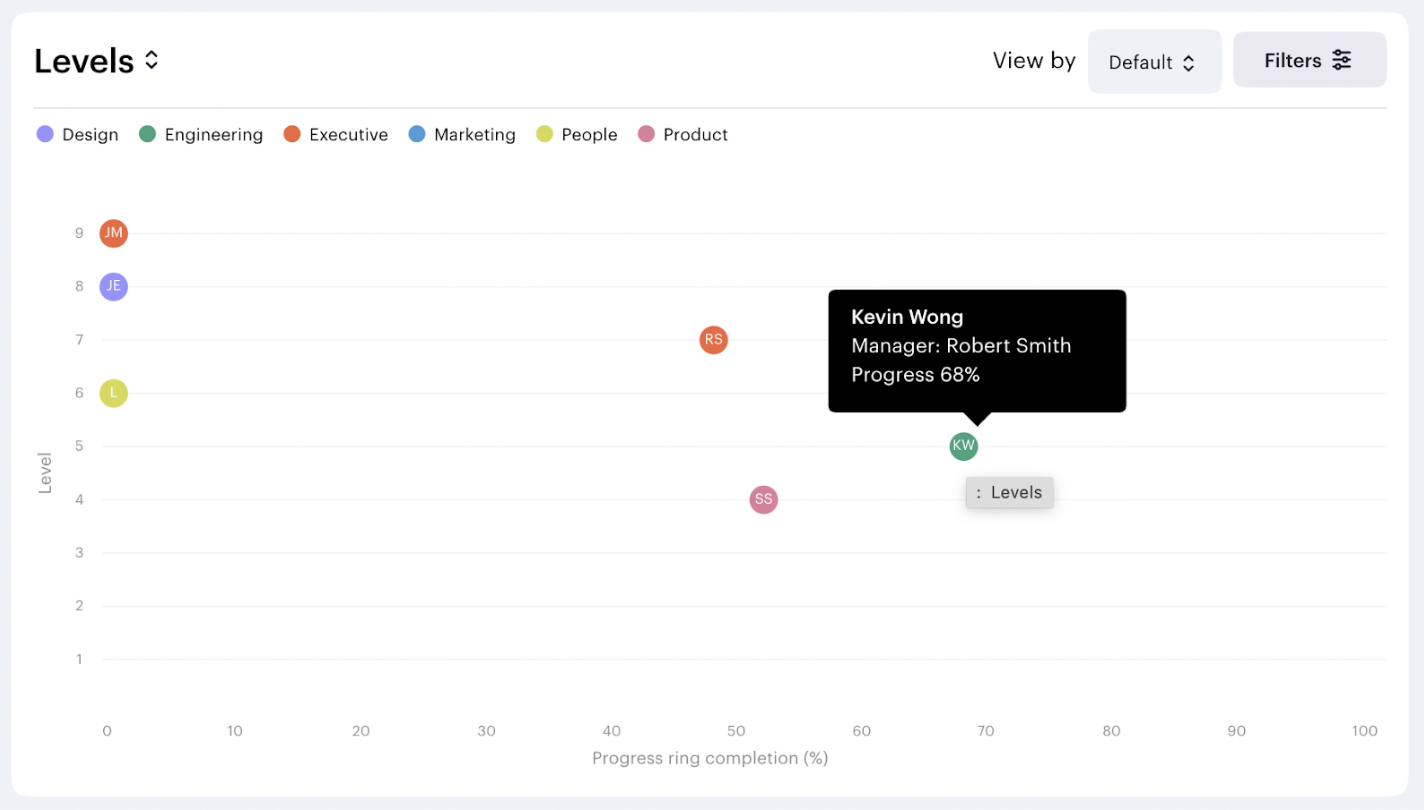
What it is: A time-based view of growth across average level and in-level progress (ring completion %). See company-wide trends or filter to any subset (function, team, cohort). You can also view individual and team growth trajectories.
Why it matters: It separates noise from signal: not just who scored what, but whether people and teams are actually advancing—toward the next level and through it.
What you do with it:

What it is: Average competency scores by department plus a level-by-level heat map inside a single rubric (darker = higher average).
Why it matters: You get a fast cross-functional benchmark on domain skills, then immediately drill into where a specific level or competency is underperforming.
What you do with it:
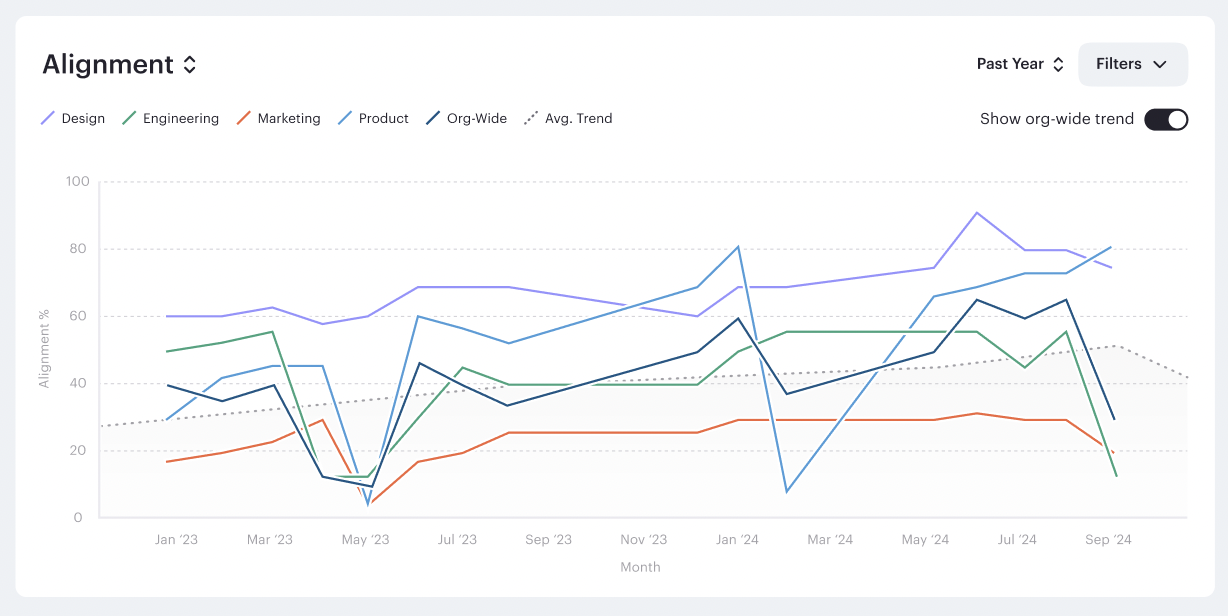
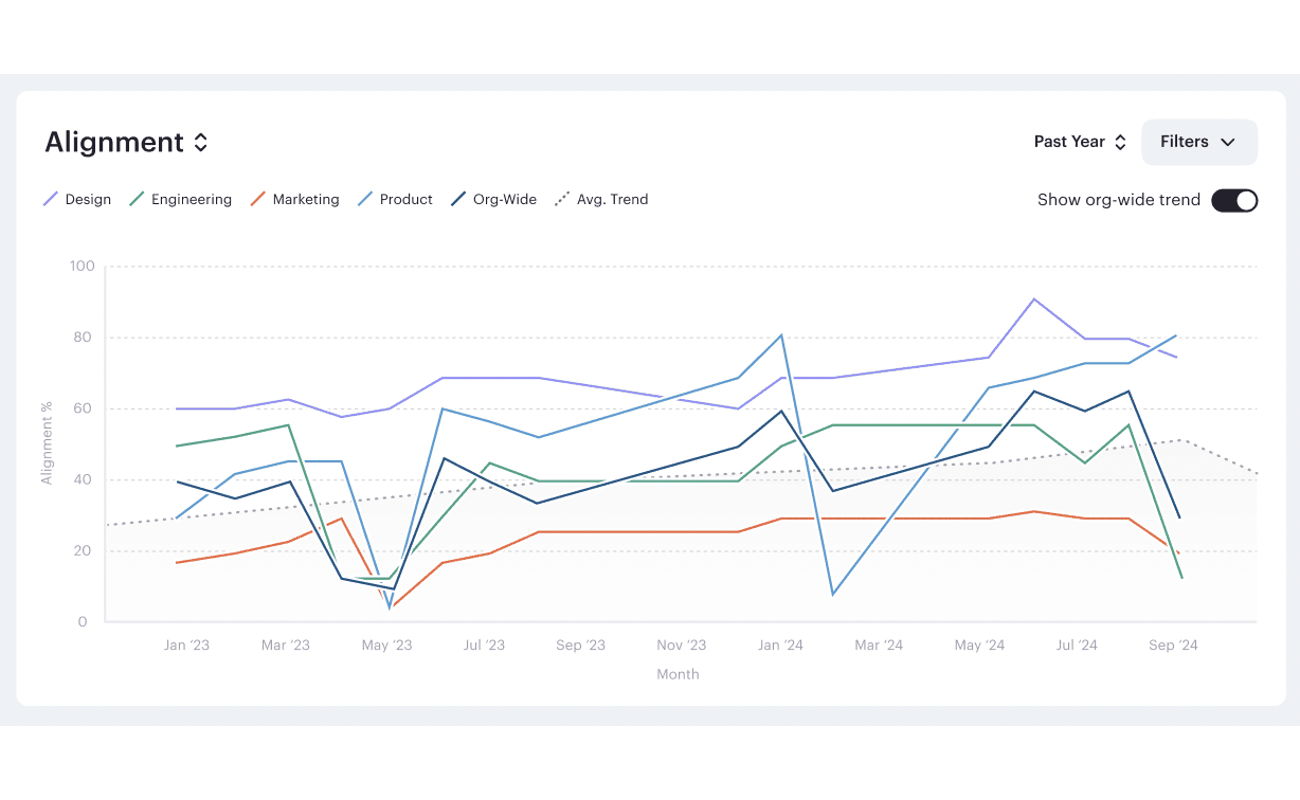
What it is: Starting alignment %—the share of ratings where managers and reports independently match—tracked over time.
Why it matters: Alignment is a proxy for clarity, trust, and a healthy review process. In Pando you should see it trend up as managers set clearer expectations and employees internalise the rubric—even with new hires entering the system. The more aligned managers and their reports are the higher performance outcomes we see.
What you do with it:
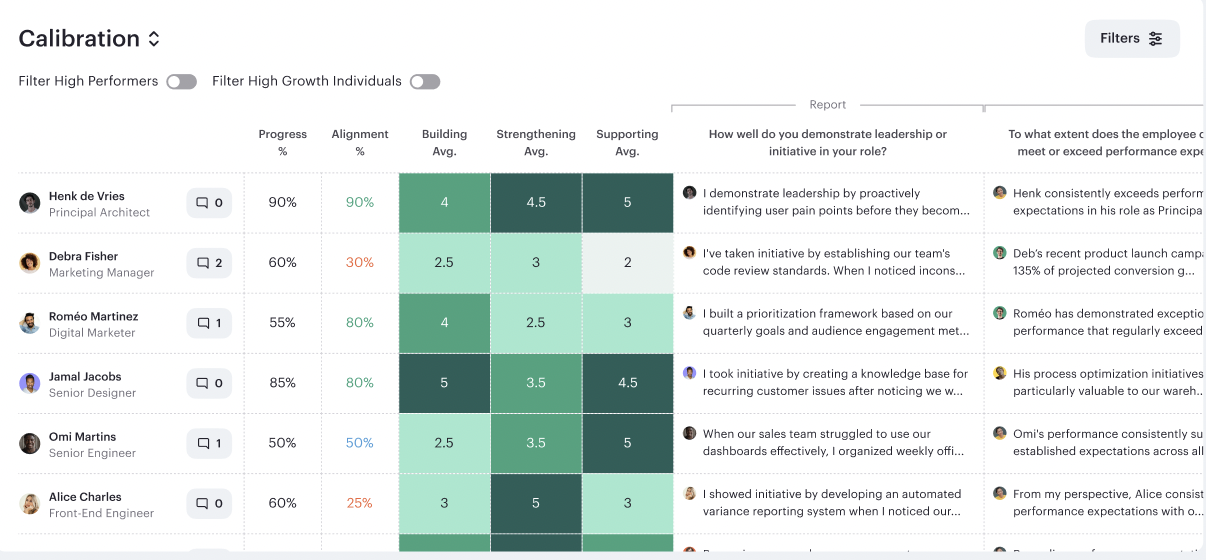
What it is: A cycle-specific workspace to review ratings, drill into competencies, mark people as calibrated, and capture notes that don’t live in the raw assessment.
Why it matters: Calibration is where performance becomes equitable and defensible. You keep the discussion structured, decisions documented, and outcomes consistent.
What you do with it:
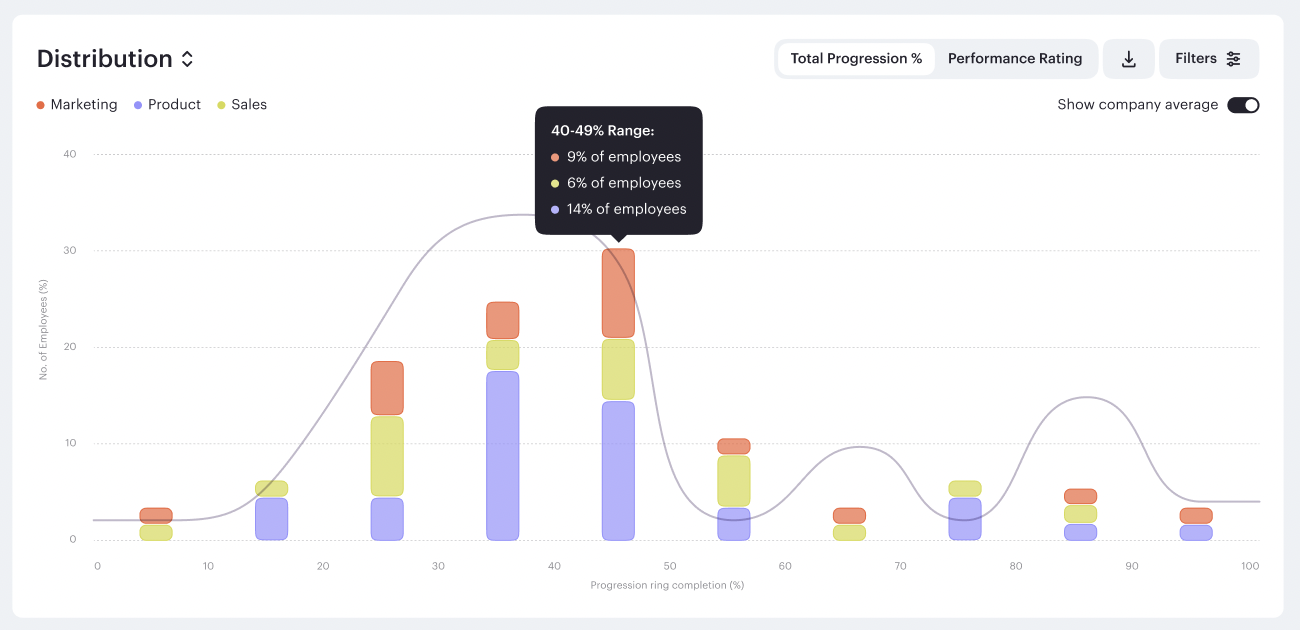
What it is: Rating distributions (performance rating or competency ratings in their rubric) by any slice—role level, department, location, manager, gender, ethnicity, etc.
Why it matters: You can spot rating drift by leader, function, or demographic—then jump straight back into Calibration to investigate. It’s the fastest way to see if your standards match reality.
What you do with it:
If you’re already using Pando, try this flow: Check Distribution for outliers → inspect them in Calibration → confirm skills in Heat Map → track improvement in Alignment. If you’re not yet on Pando, this is the difference: your performance process stops being a black box and starts compounding capability.